Loading Page.
Please wait... busy animation
Visualisation Gallery

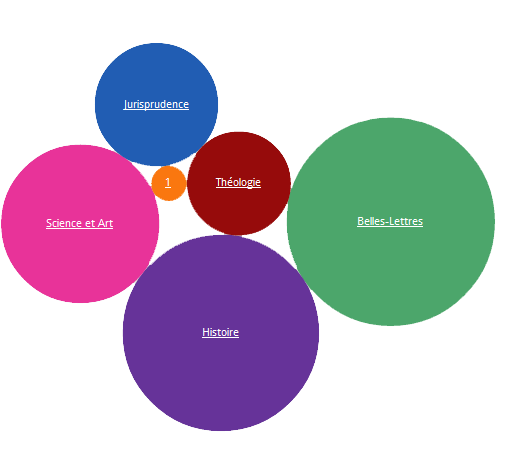
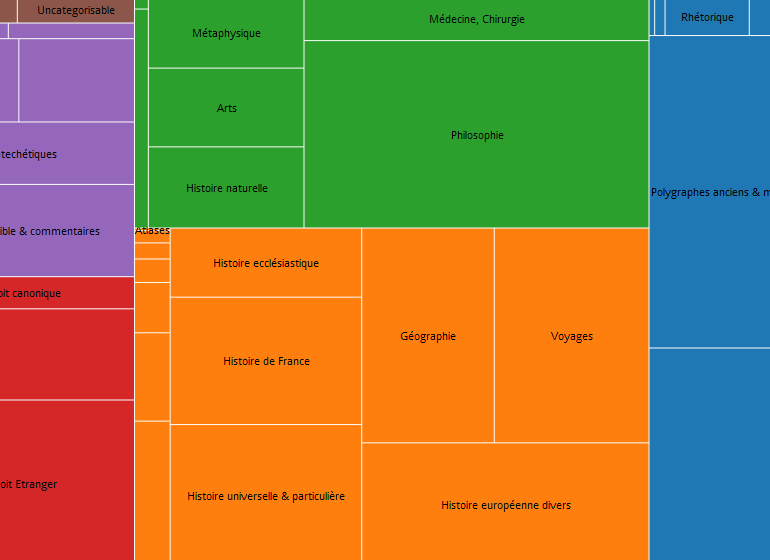
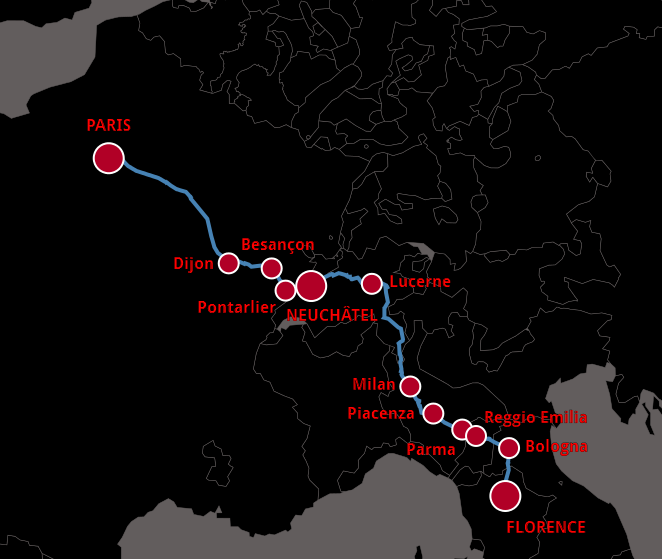
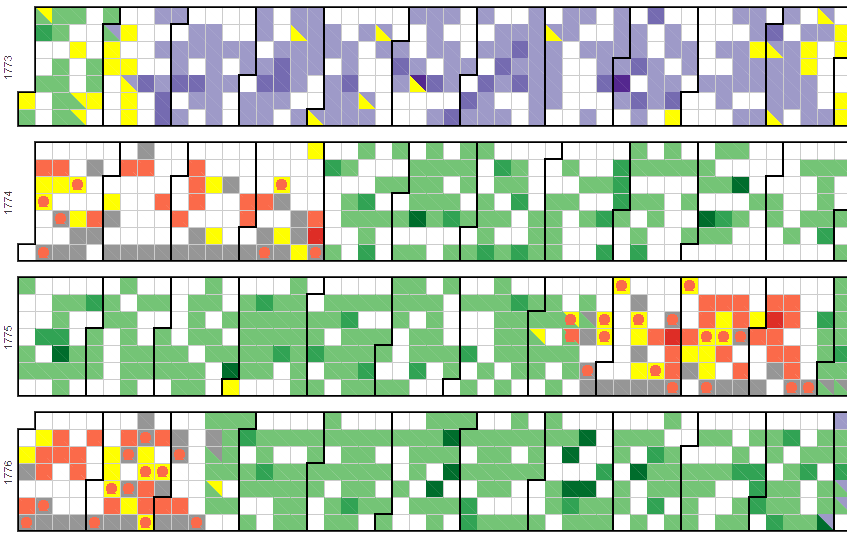
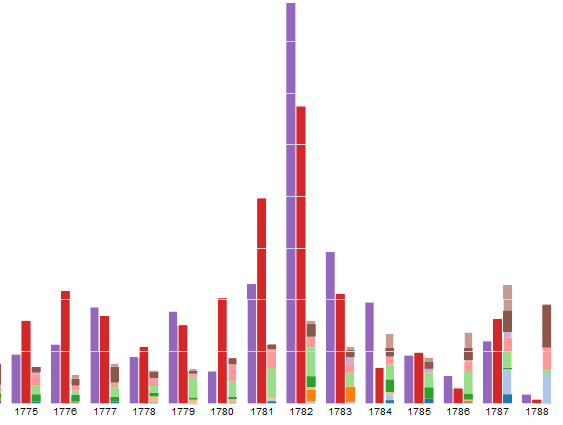
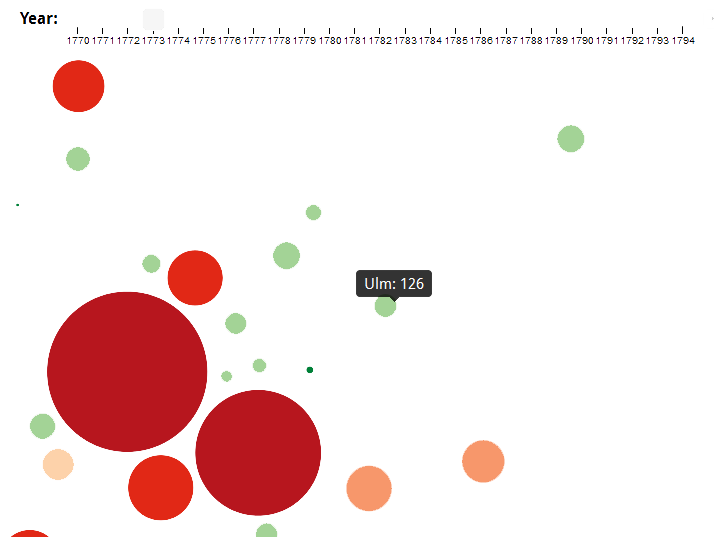
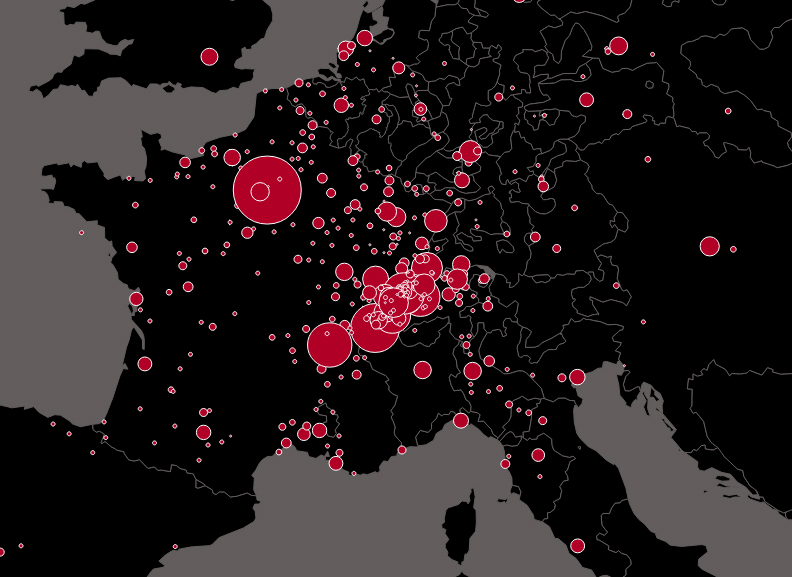
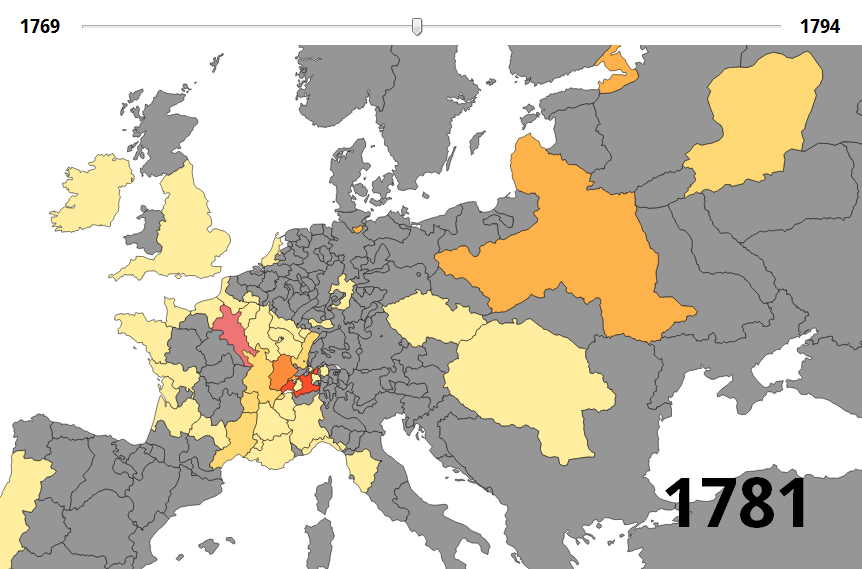
This page will enable you to visualise the data obtained by this project. These visualisations were created to complement pie charts, line graphs and other maps available on this interface. These different graphs and maps were created with d3.js or protovis.

Bubbles of Parisian Categories Treemap of Parisian Categories Two examples of STN trade routes
Calendar View of the STN orders by Manuscript Group Stacked Bar Chart displaying the annual repartition of STN sales Dorling Cartogram of the STN sales per year
Number of STN correspondents per town STN sales by year